
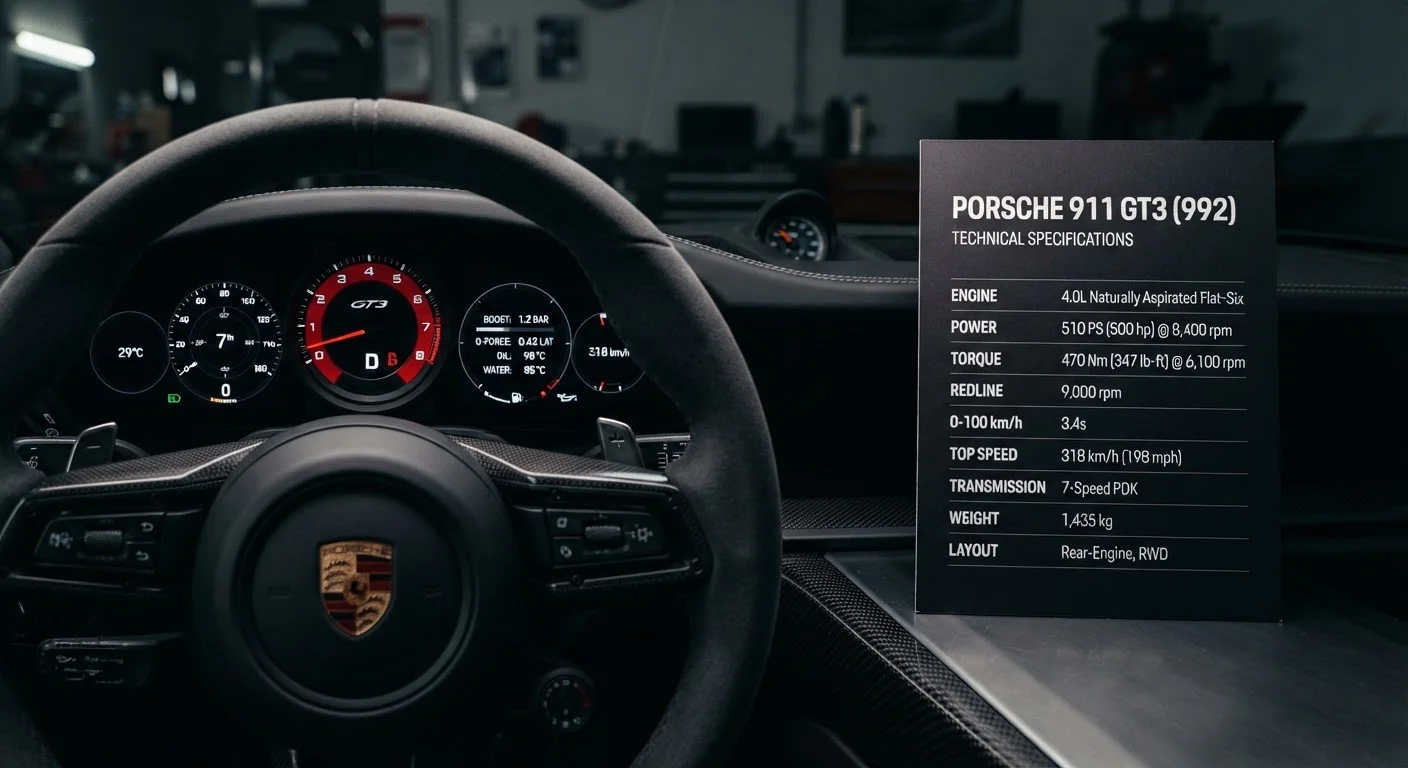
Why Spec Sheets Demand a Critical Eye
A performance vehicle's spec sheet is a curated document, not a complete truth. Manufacturers select the figures most likely to impress, measured under conditions optimized to produce the best possible result. Understanding how these numbers are generated-and where their limitations lie-is the foundation of any honest vehicle comparison. For a broader view of the engineering traits beneath the numbers, see what actually makes a vehicle a performance car.
| Primary acceleration metric | 0-60 mph (US) / 0-100 km/h (international) |
| Cornering grip measure | Lateral g-force (skidpad test) |
| Standard braking benchmark | 60-0 mph stopping distance (feet) |
| Efficiency power metric | Power-to-weight ratio (hp per ton or lb) |
| Torque measurement unit | lb-ft (pound-feet) in US market |
| Common test standard (Europe) | DIN 70020 (engine output regulation) |
The metrics below are the ones that appear most consistently across manufacturer datasheets and independent tests. Each has genuine value-but each also carries caveats that deserve equal attention.
The Core Metrics: What They Measure and Where They Fall Short
0-60 mph (or 0-100 km/h)
Acceleration from a standing start is the most widely cited performance figure. It captures how quickly a drivetrain can convert power into forward motion, influenced by horsepower, torque curve, transmission calibration, traction control logic, and tire compound. The caveat: factory figures are typically set on smooth, climate-controlled surfaces with an optimized launch procedure-conditions most drivers will never replicate. A difference of 0.3 seconds between two vehicles is often imperceptible in real-world driving.
Horsepower and Torque
Peak horsepower tells you the engine's maximum output, but only at a specific rpm. Torque-the rotational force that actually moves the car-matters equally, and the shape of the torque curve across the rev range is more useful than the peak figure alone. A turbocharged engine making broad, flat torque from low rpm can feel considerably stronger in traffic than a high-revving naturally aspirated unit with a higher peak number. Always look for torque band data alongside the headline figures.
Lateral G-Force
Measured on a skidpad, lateral g-force indicates how much cornering grip a vehicle can generate before sliding. Higher numbers reflect better tire width and compound, suspension geometry, and chassis stiffness. However, skidpad tests use a constant-radius circle at a fixed speed-a scenario that doesn't replicate real corners with changing radii, elevation changes, or combined braking and turning loads. A car with a modest skidpad figure but sharp, progressive handling can be more rewarding-and faster-on a real road.
Braking Distance
60-0 mph stopping distance (typically measured in feet) reflects the combined capability of brake rotor size, caliper clamping force, pad compound, and tire grip. It's one of the more directly comparable figures between tests, though results vary with vehicle load, brake temperature, and surface conditions. Brake feel-the pedal feedback that lets a driver modulate pressure confidently-is entirely absent from any spec sheet. As noted in our guide on pitfalls first-time performance buyers overlook, ignoring brake feel in favor of stopping-distance figures is a common and costly mistake.
Power-to-Weight Ratio
Expressed as horsepower per ton (or pound), this ratio is arguably a more honest predictor of real performance than horsepower alone. Two vehicles with identical power outputs but different curb weights will behave very differently on track and on road. Weight reduction in performance cars explores why shaving mass has measurable effects on acceleration, braking, and cornering simultaneously.
Peak Horsepower
The maximum power output an engine produces, measured at a specific rpm. It does not reflect output across the full rev range, making it an incomplete picture of real-world performance.
Torque Curve
A graph showing how rotational force (torque) varies across the engine's rpm range. A broad, flat torque curve generally indicates strong responsiveness across everyday driving conditions.
Lateral G-Force
A measure of sideways acceleration a vehicle sustains while cornering, expressed in multiples of gravitational force. Higher values indicate greater cornering grip, typically measured on a skidpad.
Power-to-Weight Ratio
The relationship between an engine's output and the vehicle's total mass. Vehicles with a higher ratio tend to accelerate, brake, and change direction more quickly than heavier alternatives with equal power.
Skidpad
A flat circular track used to measure a vehicle's maximum lateral g-force. The controlled, constant-radius format allows repeatability but does not replicate real-road corner complexity.
Curb Weight
The total weight of a vehicle without passengers or cargo, but with all standard fluids and a full fuel tank. It is the baseline mass figure used in performance calculations.
How Context Changes Everything
No single number exists in isolation. A supercar's 0-60 time is irrelevant if the buyer primarily drives congested urban streets; lateral g-force means little on a vehicle never taken to track days. Understanding which metrics align with your actual driving context-street, canyon, circuit, or touring-is the only way to extract useful signal from a spec sheet. See the full spectrum of performance vehicles for a breakdown of how different vehicle categories prioritize these metrics differently.
Independent road tests from established automotive publications provide a valuable cross-check: they measure vehicles under real-world, repeatable conditions rather than manufacturer-optimized scenarios. When factory figures and independent test results diverge significantly, that gap itself is informative.
0.3 s
Threshold where 0-60 gaps become perceptible to drivers
Automotive research broadly suggests acceleration differences below roughly 0.3 seconds are difficult to perceive without instrumentation under real driving conditions.
1.0+ g
Lateral cornering force in purpose-built track cars
High-downforce track-focused vehicles can sustain over 1.0 g of lateral force on a skidpad; most performance street cars fall in the 0.85-0.95 g range.
~100 ft
Typical 60-0 mph distance for a capable sports car
Well-sorted performance vehicles with performance tires generally stop from 60 mph within 100-115 feet under standardized test conditions.