What a Scan Tool Actually Shows You
Most vehicle owners associate scan tools with pulling fault codes - those alphanumeric strings like P0301 or P0420. But a code alone is closer to a chapter title than the full story. The real diagnostic value lies in two additional data layers: freeze frame data and live sensor readings.
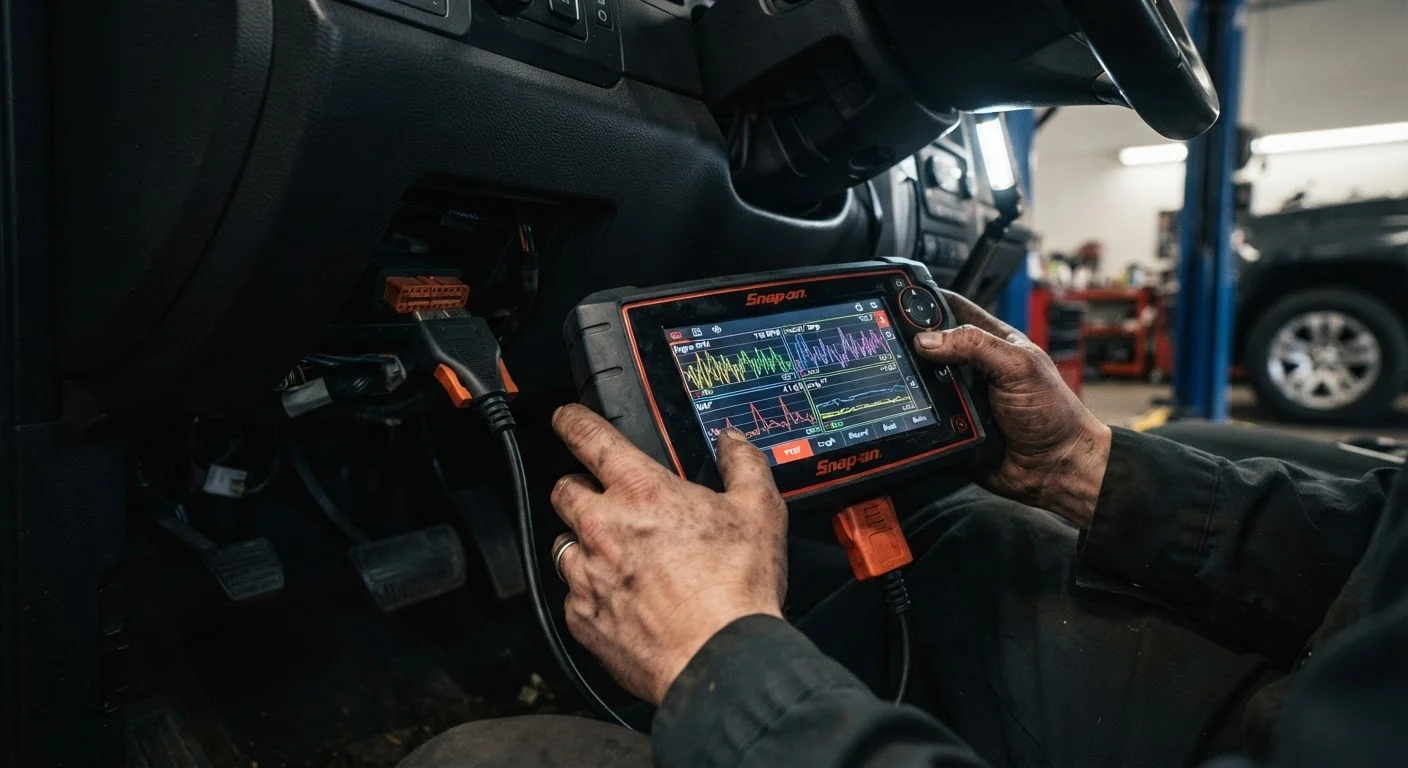
Every OBD-II compliant vehicle (model year 1996 and later in the US) stores a standardized set of parameters whenever a diagnostic trouble code (DTC) sets. A scan tool retrieves these records through the vehicle's 16-pin OBD-II data link connector (DLC), typically located under the dashboard near the steering column.
Understanding what you're looking at - and what the numbers mean - separates a productive diagnostic session from a guessing game. See our guide to interpreting check engine light fault codes for context on how codes and data work together.
Reading Freeze Frame Data: The Moment a Fault Was Recorded
Think of freeze frame data as a photograph taken the instant the ECU (engine control unit) decided something was wrong enough to log a fault code. Standardized parameters stored in every OBD-II freeze frame include:
- Engine RPM - how fast the engine was spinning
- Calculated engine load (%) - how hard the engine was working
- Coolant temperature (°F or °C) - whether the engine had warmed up
- Vehicle speed (mph or km/h) - whether the car was moving or stationary
- Short-term and long-term fuel trims (STFT / LTFT) - how much the ECU was adjusting the fuel mixture
- Manifold absolute pressure (MAP) or mass airflow (MAF) - load sensing inputs
- Throttle position (%) - driver demand at the moment of the fault
A misfire code recorded at idle with a cold engine tells a very different story than the same code captured at 65 mph under full load. Freeze frame narrows the operating conditions to investigate first.
Enhanced vs. Generic OBD-II Data
The OBD-II standard defines a mandatory set of parameters every compliant vehicle must report. However, many manufacturers add proprietary PIDs - such as transmission temperature, individual cylinder misfire counts, or hybrid battery state-of-charge - that are only accessible using a scan tool that supports that brand's enhanced protocol. A generic reader may show far fewer parameters than a factory or professional-grade tool on the same vehicle.
Live Data: Watching Sensors in Real Time
Live data - sometimes called a data stream or PID (parameter identifier) data - lets you monitor sensor outputs continuously while the engine runs. This is where you can watch an oxygen sensor cycle rich-to-lean, observe fuel trims stabilize after warm-up, or catch a coolant temperature sensor that reads -40°F regardless of actual engine temperature.
Common parameters to monitor during a live data session include:
- Upstream and downstream oxygen (O2) sensor voltage - confirm catalyst efficiency and air-fuel control
- Long-term fuel trim - reveals sustained mixture corrections that indicate a systemic issue
- Intake air temperature (IAT) - cross-check against ambient conditions
- Ignition timing advance - watch for knock retard under load
- Battery voltage - identify charging system faults
Most scan tools let you graph selected PIDs over time, which makes it far easier to spot momentary signal dropouts or erratic sensor behavior that a static snapshot would miss. Visual inspection and electronic scanning are most powerful when used together - live data guides your eyes to the right component.
Record Freeze Frame Before Clearing Codes
Always photograph or write down freeze frame values before clearing any diagnostic trouble codes. Erasing codes deletes the freeze frame snapshot permanently. If the fault is intermittent and doesn't return quickly, you'll lose the only record of the conditions that triggered it - making diagnosis significantly harder.
Putting Both Data Sources Together
The most reliable diagnostic process uses freeze frame to establish the conditions that triggered a fault, then uses live data to reproduce those conditions and confirm whether the fault is still present or intermittent. An intermittent fault that only appears during cold starts, for example, may show normal readings during a warm workshop test - the freeze frame tells you exactly when and where to look.
1996
Year OBD-II became federally mandated
The US EPA required all passenger cars and light trucks sold in the United States to comply with the OBD-II standard from the 1996 model year onward.
~200+
Available PIDs on a modern vehicle
While the OBD-II standard mandates a core set of parameters, many modern vehicles expose 200 or more manufacturer-specific PIDs accessible through enhanced scan tool protocols.
1 snapshot
Freeze frames stored per DTC (OBD-II minimum)
The base OBD-II standard requires at least one freeze frame record per stored MIL-triggering fault code; some manufacturers store multiple frames or extended records.
Fuel trim interpretation is a good illustration of how context matters. A short-term fuel trim of +15% recorded in freeze frame during a cold idle suggests the ECU was adding fuel, which could point to a vacuum leak, a weak fuel injector, or a faulty MAF sensor. Watching live fuel trims during a warm idle, then at 2,500 RPM, and again under load helps narrow which scenario fits.
For vehicle owners curious about what they can realistically do themselves, see our article on vehicle self-diagnosis. Reading and recording scan tool data is well within reach for a careful owner - but interpreting that data to make confident repair decisions often benefits from professional experience, especially for emission-related or safety-critical faults.
This article is for informational and educational purposes only. Always consult a qualified automotive technician before performing repairs, especially on safety-critical vehicle systems.