Why Spec Sheets Are Harder to Read Than They Look
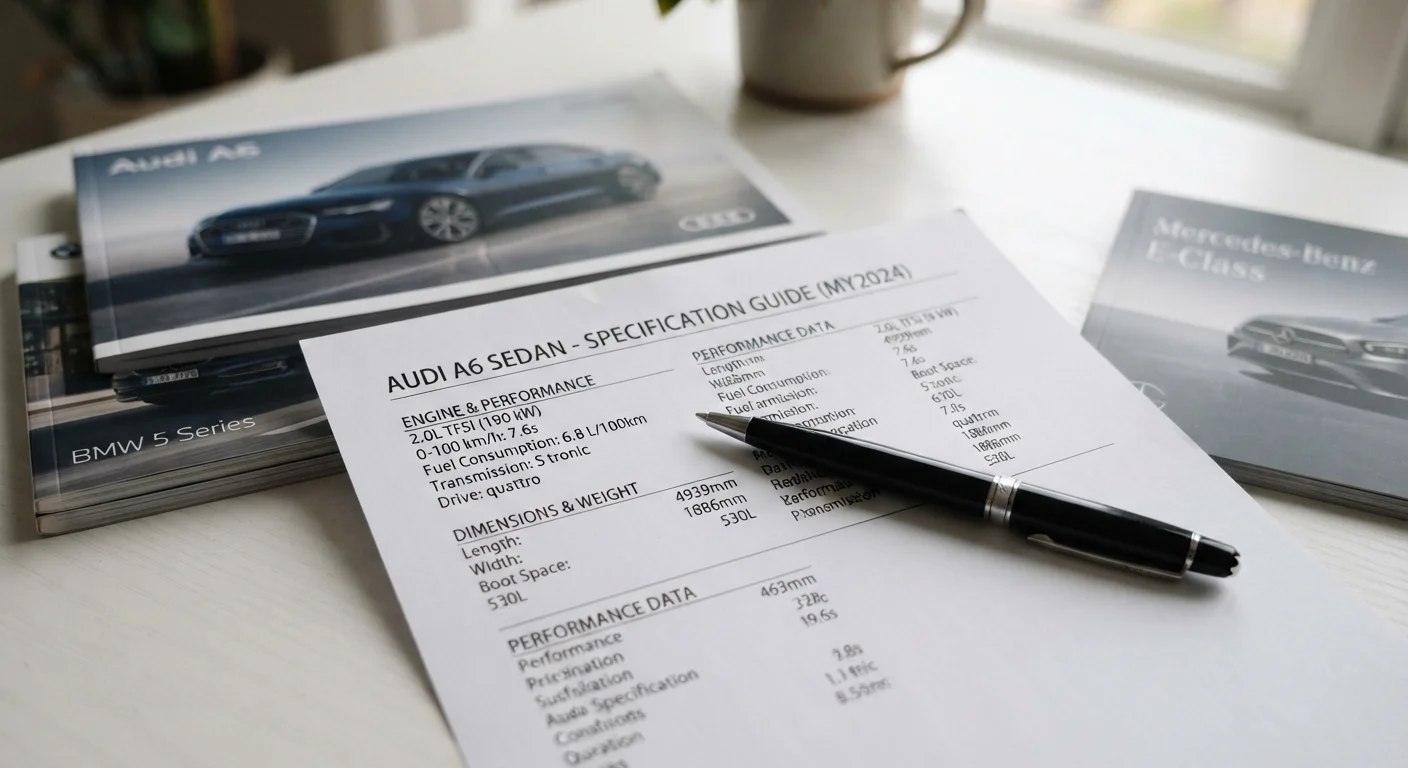
A sedan spec sheet looks like a straightforward data dump - rows of numbers and abbreviations covering everything from engine displacement to coefficient of drag. The problem isn't the volume of information; it's knowing which figures actually translate to a meaningful difference in how a car drives, fits, and costs to own.
Manufacturers format spec sheets to highlight flattering numbers and bury context. A 300-horsepower figure sounds impressive until you notice it's achieved only at 7,000 rpm - an engine speed most drivers rarely touch during a commute. Understanding the conditions behind each number is as important as the number itself.
This guide walks through the categories most likely to trip up sedan shoppers and explains what each figure is actually measuring - and what it isn't.
Powertrain Figures: What Horsepower and Torque Actually Mean
Horsepower and torque are the two most cited - and most misunderstood - powertrain figures. Horsepower measures the rate at which an engine does work; it governs top-end speed and sustained acceleration at highway velocities. Torque measures rotational force and determines how quickly the engine responds at lower speeds - which is what you feel during city driving, merging, and passing.
For sedans used in everyday commuting, torque at low-to-mid rpm is usually the more relevant figure. A turbocharged four-cylinder producing 280 lb-ft of torque from 1,800 rpm will feel quicker off the line than a naturally aspirated six-cylinder with higher peak horsepower but a narrower torque band.
10-20%
Typical real-world mpg gap below EPA estimates
The U.S. Department of Energy notes that actual fuel economy commonly falls within this range below EPA test results depending on driving conditions and habits.
1,500 rpm
Torque delivery start for many modern turbocharged sedans
Many current turbocharged four-cylinder engines are engineered to deliver peak torque from as low as 1,500 rpm, improving low-speed responsiveness versus older naturally aspirated designs.
Transmission type also modifies these figures in practice. The same engine paired with an eight-speed automatic versus a continuously variable transmission (CVT) can produce noticeably different acceleration responses. Always check which transmission is standard on the trim level you're evaluating.
If you're interested in how these concepts scale to more extreme applications, our guide to performance spec sheet metrics breaks down figures like lateral g-force and braking distance in greater detail.
Dimensions That Define Daily Usability
Dimensional specs - wheelbase, overall length, width, and height - directly shape the ownership experience in ways drivers feel every day.
- Wheelbase is the distance between the front and rear axles. A longer wheelbase generally means more rear-seat legroom and a smoother ride over road imperfections. Shorter wheelbases make a car more maneuverable in tight urban spaces.
- Overall length and width determine parking ease and garage fit. These figures matter more than most buyers anticipate before they own the car.
- Track width - the distance between left and right wheels - influences cornering stability. Wider tracks typically produce flatter, more planted cornering behavior.
Interior dimensions like headroom, legroom, and shoulder room are separate from exterior figures and warrant their own evaluation. Reading interior sedan dimensions explains how to interpret those measurements for real-world comfort.
Use Manufacturer Specs as a Starting Point Only
All figures on a manufacturer spec sheet are gathered under controlled, standardized conditions. Independent testing from automotive publications and third-party reviewers often reveals meaningful real-world differences. Before finalizing a comparison, verify key figures - especially fuel economy and interior dimensions - against at least one independent source.
Fuel Economy, Curb Weight, and the Numbers That Affect Running Costs
EPA fuel economy estimates (city/highway/combined mpg) are standardized across all manufacturers, making them useful for direct comparisons - but they are not guarantees. Real-world mpg typically falls 10-20% below EPA estimates depending on driving style, climate, and load. Treat the combined figure as a relative benchmark, not a prediction.
Curb weight is the vehicle's weight with standard equipment and fluids but no passengers or cargo. Heavier sedans generally require more braking distance, consume more fuel, and place greater demands on tires. However, added weight can also improve ride quality and high-speed stability on some platforms.
When comparing sedans to crossovers or SUVs, these figures often tell a clearer story than marketing descriptions alone. For a broader framework, comparing sedans and SUVs across key real-world metrics provides useful context beyond the spec sheet.
Finally, don't overlook safety ratings - they're not always included in manufacturer spec sheets but are essential comparative data. Understanding NHTSA and IIHS scores is a practical companion to any spec-sheet review.