What a Nautical Chart Actually Tells You
A nautical chart is a precisely surveyed representation of a body of water and its surroundings. Unlike a road map, a chart's most critical information lies under the surface - depths, hazards, and bottom composition that determine whether a route is navigable for your vessel. Charts also depict the shoreline, landmarks, navigational aids, regulated areas, and magnetic variation data needed to plot accurate courses.
In the United States, the NOAA Office of Coast Survey is responsible for producing and maintaining official nautical charts covering US coastal, Great Lakes, and inland waters. These charts are available free of charge in digital form through NOAA's website and are updated through a continuous Notice to Mariners process.
Before you begin interpreting chart detail, it helps to be comfortable with basic vessel terminology. Our guide to boat anatomy covers the foundational terms you'll encounter when translating chart information into real on-water decisions.
What you will need
Tools You'll Need
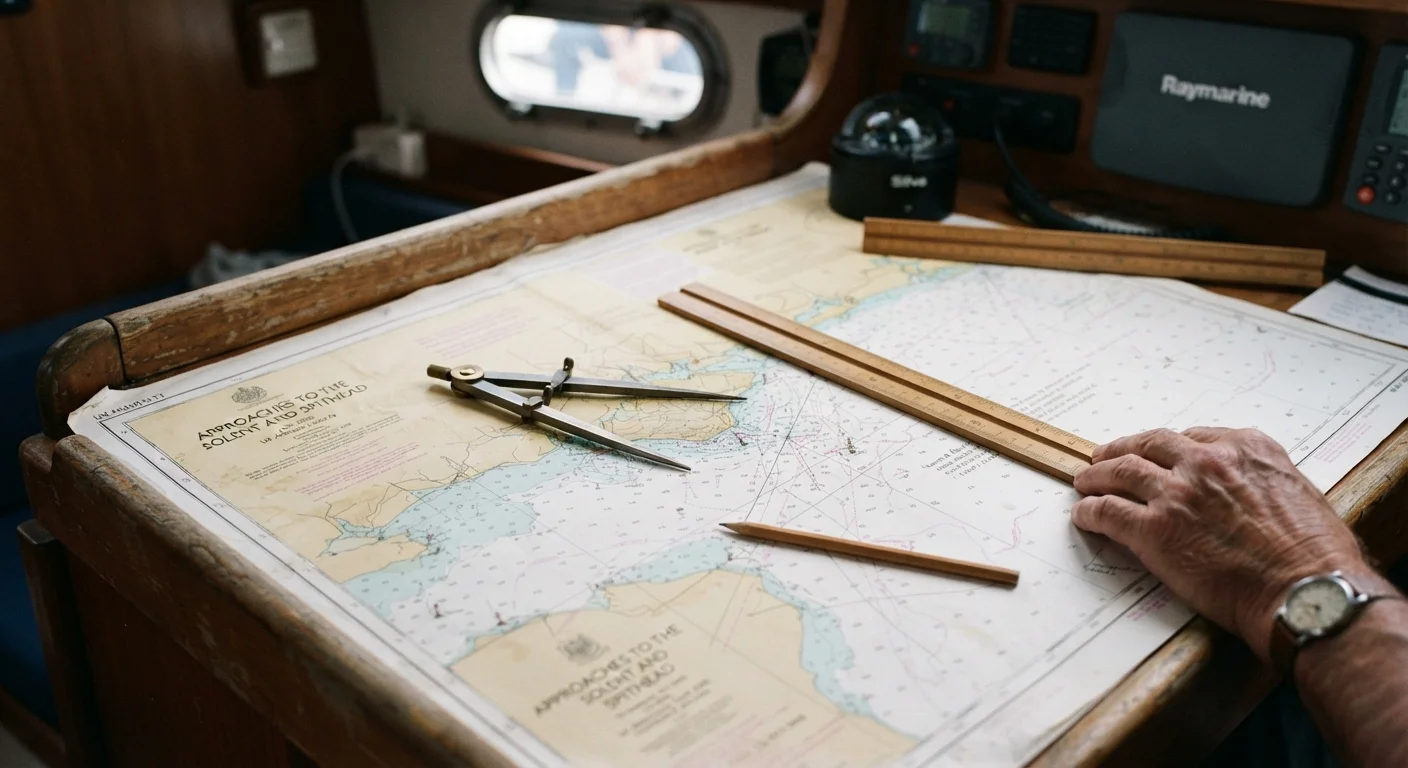
Reading a nautical chart is a learnable skill that requires only a handful of tools to get started. The most important companion document is NOAA Chart No. 1 - a free reference booklet that catalogs every symbol, abbreviation, and line style used on US charts. Keep it accessible whenever you're studying a new chart area.
NOAA Nautical Chart
The primary document you are learning to read - covers depths, hazards, and navigational aids for a specific waterway.
NOAA Chart No. 1
The official reference booklet decoding every symbol and abbreviation used on US nautical charts.
Parallel Rulers or Plotter
Used to transfer bearings and draw course lines accurately across the chart.
Dividers
Measures distances on the chart by stepping against the latitude scale on the chart margins.
Chartplotter or Navigation App
Displays electronic versions of NOAA charts with GPS overlay for real-time position tracking.
As you grow more confident with paper charts, pairing them with marine electronics - particularly a chartplotter - creates a powerful redundant system. Electronics show your real-time GPS position overlaid on the same chart data; paper charts provide a reliable backup when technology fails.
Step-by-Step: Reading the Key Elements
Work through the following steps each time you pick up a new chart for an unfamiliar area. The sequence moves from foundational orientation (scale and datum) through the layered details of depths, hazards, aids to navigation, and course plotting.
Depth Datum Is Not Guaranteed Water Depth
Charted depths reference MLLW, a statistical average of the lowest daily tides - not the absolute lowest possible water level. Storm surges, strong winds, and extreme tidal cycles can all push actual water levels below charted depths. Always account for tidal range and current conditions when assessing whether a route is safe for your vessel's draft.
Identify the Chart Scale and Sounding Units
Before reading any other element, locate the chart's title block - typically in a corner or open water area. It tells you the chart's scale (e.g., 1:80,000), the unit used for depth soundings (feet, fathoms, or meters), and the datum to which depths are referenced. In US waters, MLLW is the standard depth datum, meaning charted depths represent the shallowest conditions you are likely to encounter at low tide.
Confirm the sounding unit before you go any further. A depth of 12 on a fathom chart means 72 feet - a very different situation from 12 feet.
Read the Depth Soundings Across the Chart
Depth soundings appear as small numbers scattered across the water areas of the chart. Each number represents the water depth at that specific location at the chart datum. Shallower areas are often shaded in progressively lighter blue tones, while deep water appears white or dark blue depending on the chart style.
Identify any areas where soundings cluster tightly with rapidly changing values - these indicate uneven bottom topography, submerged ridges, or shoals that deserve careful attention during passage planning.
Interpret Hazard and Obstruction Symbols
Charts mark underwater and surface hazards using standardized symbols defined in NOAA Chart No. 1. Common examples include:
- Rocks awash - asterisk-style symbol indicating rock at or near the water's surface
- Submerged rocks - a cross or plus symbol with a surrounding circle
- Wrecks - depicted with a vessel outline, sometimes marked Wk
- Shoals - labeled areas of shallow water, often with surrounding depth soundings to indicate extent
Each hazard type requires different navigational caution - a submerged rock at low tide may be passable at high tide for shallow-draft boats, but only if you have confirmed the depths involved.
Decode Buoy and Navigational Aid Symbols
Buoys and fixed aids to navigation are shown on charts as colored symbols with associated labels indicating light characteristics, color, and number. The US lateral system (part of the IALA Region B system used in US waters) follows the "red, right, returning" convention - red buoys on your starboard side when returning from sea.
Chart symbols for buoys show:
- Shape (can, nun, spherical, pillar)
- Color (R = red, G = green, RW = red and white, etc.)
- Light characteristics if lit (e.g., Fl G 4s = flashing green every 4 seconds)
- Identifying number or letter
Read Bottom Composition Codes
Scattered throughout water areas, you'll find abbreviated codes describing the seabed composition. These matter for anchoring - knowing whether the bottom is sand (S), mud (M), rock (R), or gravel (G) helps you select the right anchor type and anticipate holding quality.
Common abbreviations include: S (sand), M (mud), Rk (rock), Co (coral), Sh (shells). Combinations such as fS mean fine sand. All abbreviations are fully defined in NOAA Chart No. 1.
Use the Compass Rose to Orient and Plot Bearings
Every nautical chart includes one or more compass roses - concentric circles printed with degree markings. The outer ring shows true north bearings aligned with geographic north. The inner ring shows magnetic north, offset by the local magnetic variation (declination) noted at the chart's center.
Use parallel rulers or a plotter to transfer a bearing from the compass rose to your intended course line. If your compass reads in magnetic degrees (as most marine compasses do), use the magnetic (inner) ring. Understanding this distinction prevents systematic navigation errors.
Pair Paper Charts with Electronics
Electronic chartplotters and navigation apps (such as those displaying NOAA raster or vector charts) provide GPS-confirmed position overlaid on the same chart data. However, electronics can fail due to power loss, software errors, or GPS signal issues. Carrying a current paper chart and knowing how to read it independently remains a recognized best practice in recreational and professional seamanship.
Putting It All Together for Passage Planning
Once you can read individual chart elements, the next step is integrating them into a coherent passage plan. Identify your departure and destination points, then trace a route that maintains adequate depth margin over your vessel's draft, clears all charted hazards, and aligns with the buoyed channel where one exists.
Note any restricted or regulated areas along your route - anchorage zones, speed restriction areas, marine protected areas, and traffic separation schemes are all marked with specific chart symbols defined in Chart No. 1. Understanding these overlaps with maritime navigation rules, which govern right-of-way and vessel conduct in different waterway types.
Chart Currency Matters
Nautical charts are only as reliable as their last update. Channels are dredged, buoys are repositioned, and new hazards are charted regularly. Before any voyage, check NOAA's Notice to Mariners and Local Notice to Mariners for updates affecting your area. An outdated chart can give a false sense of security in waters that have changed.
Chart reading is a foundational skill that supports everything else in boating - from selecting the right boat category for your intended waters to interpreting the draft figures on a boat specification sheet. Invest time practicing with charts before you need them underway.